Construction Progress Report: Template, Example and Method 2026
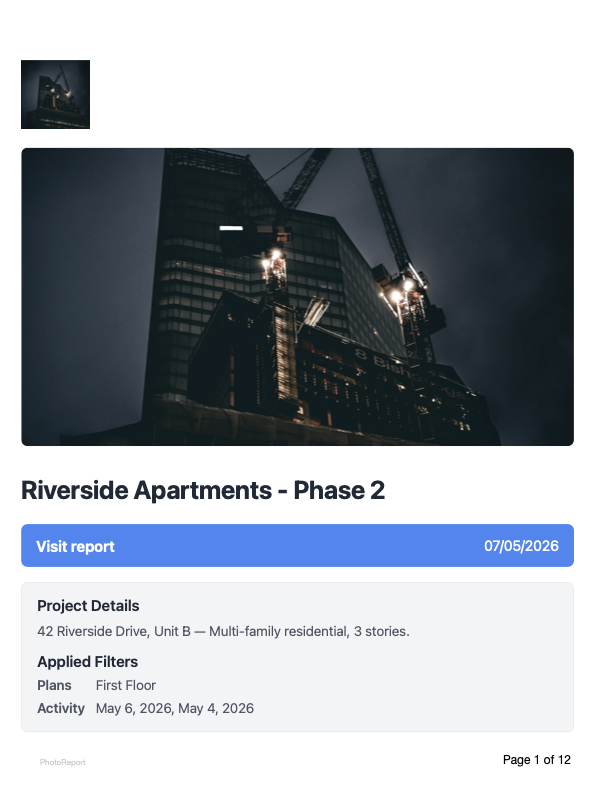
The question everyone keeps asking you: where does the project stand?
The client asks it in the meeting, the lender asks it before releasing a payment, your partner asks it on Friday evening. “Where does the project stand?” A spoken answer never cuts it: it can’t be verified, it can’t be archived, and it protects no one the day a delay turns into a dispute. The construction progress report is the document that answers in black and white, trade by trade, with photos to back it up. Provided, of course, that it measures the right rate, that it gets compared to the schedule, and that it lands quickly enough to stay actionable.
This guide gives the exact definition of a progress report and what sets it apart from the daily report and the site visit report, the list of information it must contain, the method for measuring both physical and financial percent-complete, a template with a filled example, and a way to produce the whole thing straight from the field while keeping dated progress photos pinned to a plan.
What is a construction progress report?
A construction progress report is a periodic document that measures, on a given date, the actual state of the works against the planned schedule. It is usually written by the project manager, the site manager or the scheduling coordinator, then circulated to the client, sometimes to the lender or to the building owners’ association. Its frequency depends on the phase: weekly during structural works when things move fast, monthly during the financial reporting phase to settle progress claims.
Its job is not to recount what happened day by day, but to answer a single quantified question: how much of the project is done, how much remains, and is that in line with the contract schedule. A good progress report fits on a few pages, leans on percentages by trade, and every figure stated is defensible by a dated, located photo. That demand for proof is what separates a report taken seriously from a finger-in-the-air estimate that no one signs off.
Progress, daily, site visit: don’t mix them up
Three documents often coexist on the same project, and confusing them wastes everyone’s time. They have neither the same author, nor the same frequency, nor the same purpose.
| Document | Frequency | Typical author | Purpose |
|---|---|---|---|
| Progress report | Weekly to monthly | Project manager, site manager, scheduling coordinator | Measure the % complete by trade and compare it to the schedule |
| Daily report | Daily | Site manager or foreman | Log weather, headcount, tasks, deliveries, incidents |
| Site visit report | Occasional | Architect, project manager, inspector | Observe, log non-conformities, request corrective actions |
In short: the daily report answers “what did we do today?”, the site visit report answers “what did we observe during this visit?”, and the progress report answers “where do we stand overall against the schedule?”. All three feed on the same field observations, but the progress report is the only one that aggregates and quantifies.
When and why to produce one
The progress report is not a paperwork exercise. It supports several concrete decisions, and that is what justifies the time spent on it.
Justifying progress claims and interim payments. On most contracts, paying the firms follows the actual progress. A poorly documented rate means a contested claim and a blocked payment. The progress report, photos to back it up, becomes the document that releases payment without argument.
Keeping the client and the lender informed. An investor, an owners’ association or a bank funding the works wants regular visibility. A clear monthly report, with an overall rate and progress photos, beats ten reassuring phone calls.
Pinning down a delay before it spirals. Comparing actual progress to the planned schedule surfaces any slippage as soon as it appears, trade by trade. Documented early, a delay is handled by a decision (extra crew, rescheduling). Discovered late, it ends in penalties and a crisis meeting.
Keeping an enforceable record. In a dispute over deadlines, the series of dated progress reports is the strongest history for showing when a trade fell behind and who had been informed.
What a progress report must contain
The structure of a progress report is predictable, so the reader always finds the information in the same place. Here are the expected sections.
| Section | Content |
|---|---|
| Header | Project, address, report number, period covered, date issued, author, recipients |
| Overall percent-complete | Physical percent-complete of the project at the date, compared to planned |
| Progress by trade | Trade-by-trade table: % complete, % planned, variance, comment |
| Work done during the period | What actually advanced since the last report |
| Comparison to the schedule | Variance against the contract schedule, trades ahead, trades behind |
| Blockers and open items | What is slowing progress: supplies, bad weather, unresolved punch-list items, pending decisions |
| Progress photos | Dated shots located on the plan, justifying the stated rates |
| Next steps | What is planned for the next period, upcoming milestones |
The two sections that make the difference are progress by trade and the photos. An overall rate on its own says nothing actionable. It is the trade-by-trade read, cross-checked against the photos, that lets the client understand where the project is speeding up and where it is stalling.
Measuring percent-complete: physical and financial
There are two ways to quantify progress, and confusing them creates costly misunderstandings.
Physical progress measures the share of works actually carried out, independent of money. A paint trade at 60% physical means 60% of the planned surfaces are painted. That is what a visit measures and what photos prove.
Financial progress measures the share of the contract amount already justified for payment. It follows from physical progress applied to the price of each item, but the two can diverge: a trade can be physically advanced without the most expensive elements being installed, or the other way round.
The most robust method is to calculate progress per trade, then weight by each trade’s share of the contract to get the overall rate. Here is an example on a renovation project at the halfway mark:
| Trade | Share of contract | Physical progress | Planned progress | Variance |
|---|---|---|---|---|
| Structural works | 30 % | 100 % | 100 % | on track |
| Partitions / linings | 20 % | 80 % | 85 % | -5 % |
| Electrical | 15 % | 55 % | 70 % | -15 % |
| Plumbing / HVAC | 15 % | 60 % | 65 % | -5 % |
| Paint / finishes | 20 % | 20 % | 25 % | -5 % |
The weighted overall rate here comes out at roughly 67% physical, against 73% planned, a global delay of 6 points. The trade-by-trade read shows immediately that the delay is concentrated in electrical (-15%), far more useful information than a plain “we’re a bit behind”.
Template and filled example
Here is a progress report template filled in for an office renovation project, period 11 to 18 May 2026, report no. 14. The numbers in the “Photo” column refer to markers placed on the attached plan.
Header
| Field | Value |
|---|---|
| Project | Saint-Lazare Office Renovation, Building B |
| Address | 14 rue de Rome, 75008 Paris |
| Report no. | 14 |
| Period | 11/05/2026 to 18/05/2026 |
| Author | J. Martin, project manager |
| Recipients | Client, main contractor, trades concerned |
| Overall progress | 67 % physical (planned: 73 %, 6-point delay) |
Progress by trade
| Trade | Complete | Planned | Variance | Comment | Photo |
|---|---|---|---|---|---|
| Partitions | 80 % | 85 % | -5 % | Floor 2 finished, floor 3 in progress | P-01 |
| Electrical | 55 % | 70 % | -15 % | Cable trays behind, awaiting switchboard delivery | P-02, P-03 |
| Plumbing / HVAC | 60 % | 65 % | -5 % | Networks installed, awaiting connections | P-04 |
| Paint | 20 % | 25 % | -5 % | Floor 1 started, on track | P-05 |
Blockers
| Item | Impact | Responsible | Due |
|---|---|---|---|
| Electrical switchboard delivery | Blocks progress on the electrical trade | Supplier via main contractor | 26/05/2026 |
| Paint color sign-off | Blocks the start of floor 2 | Client | 22/05/2026 |
It is this level of granularity that makes a progress report usable. A client reading this table knows in thirty seconds that the project is slipping by six points, that the cause is electrical, and that two specific decisions would unblock the situation.
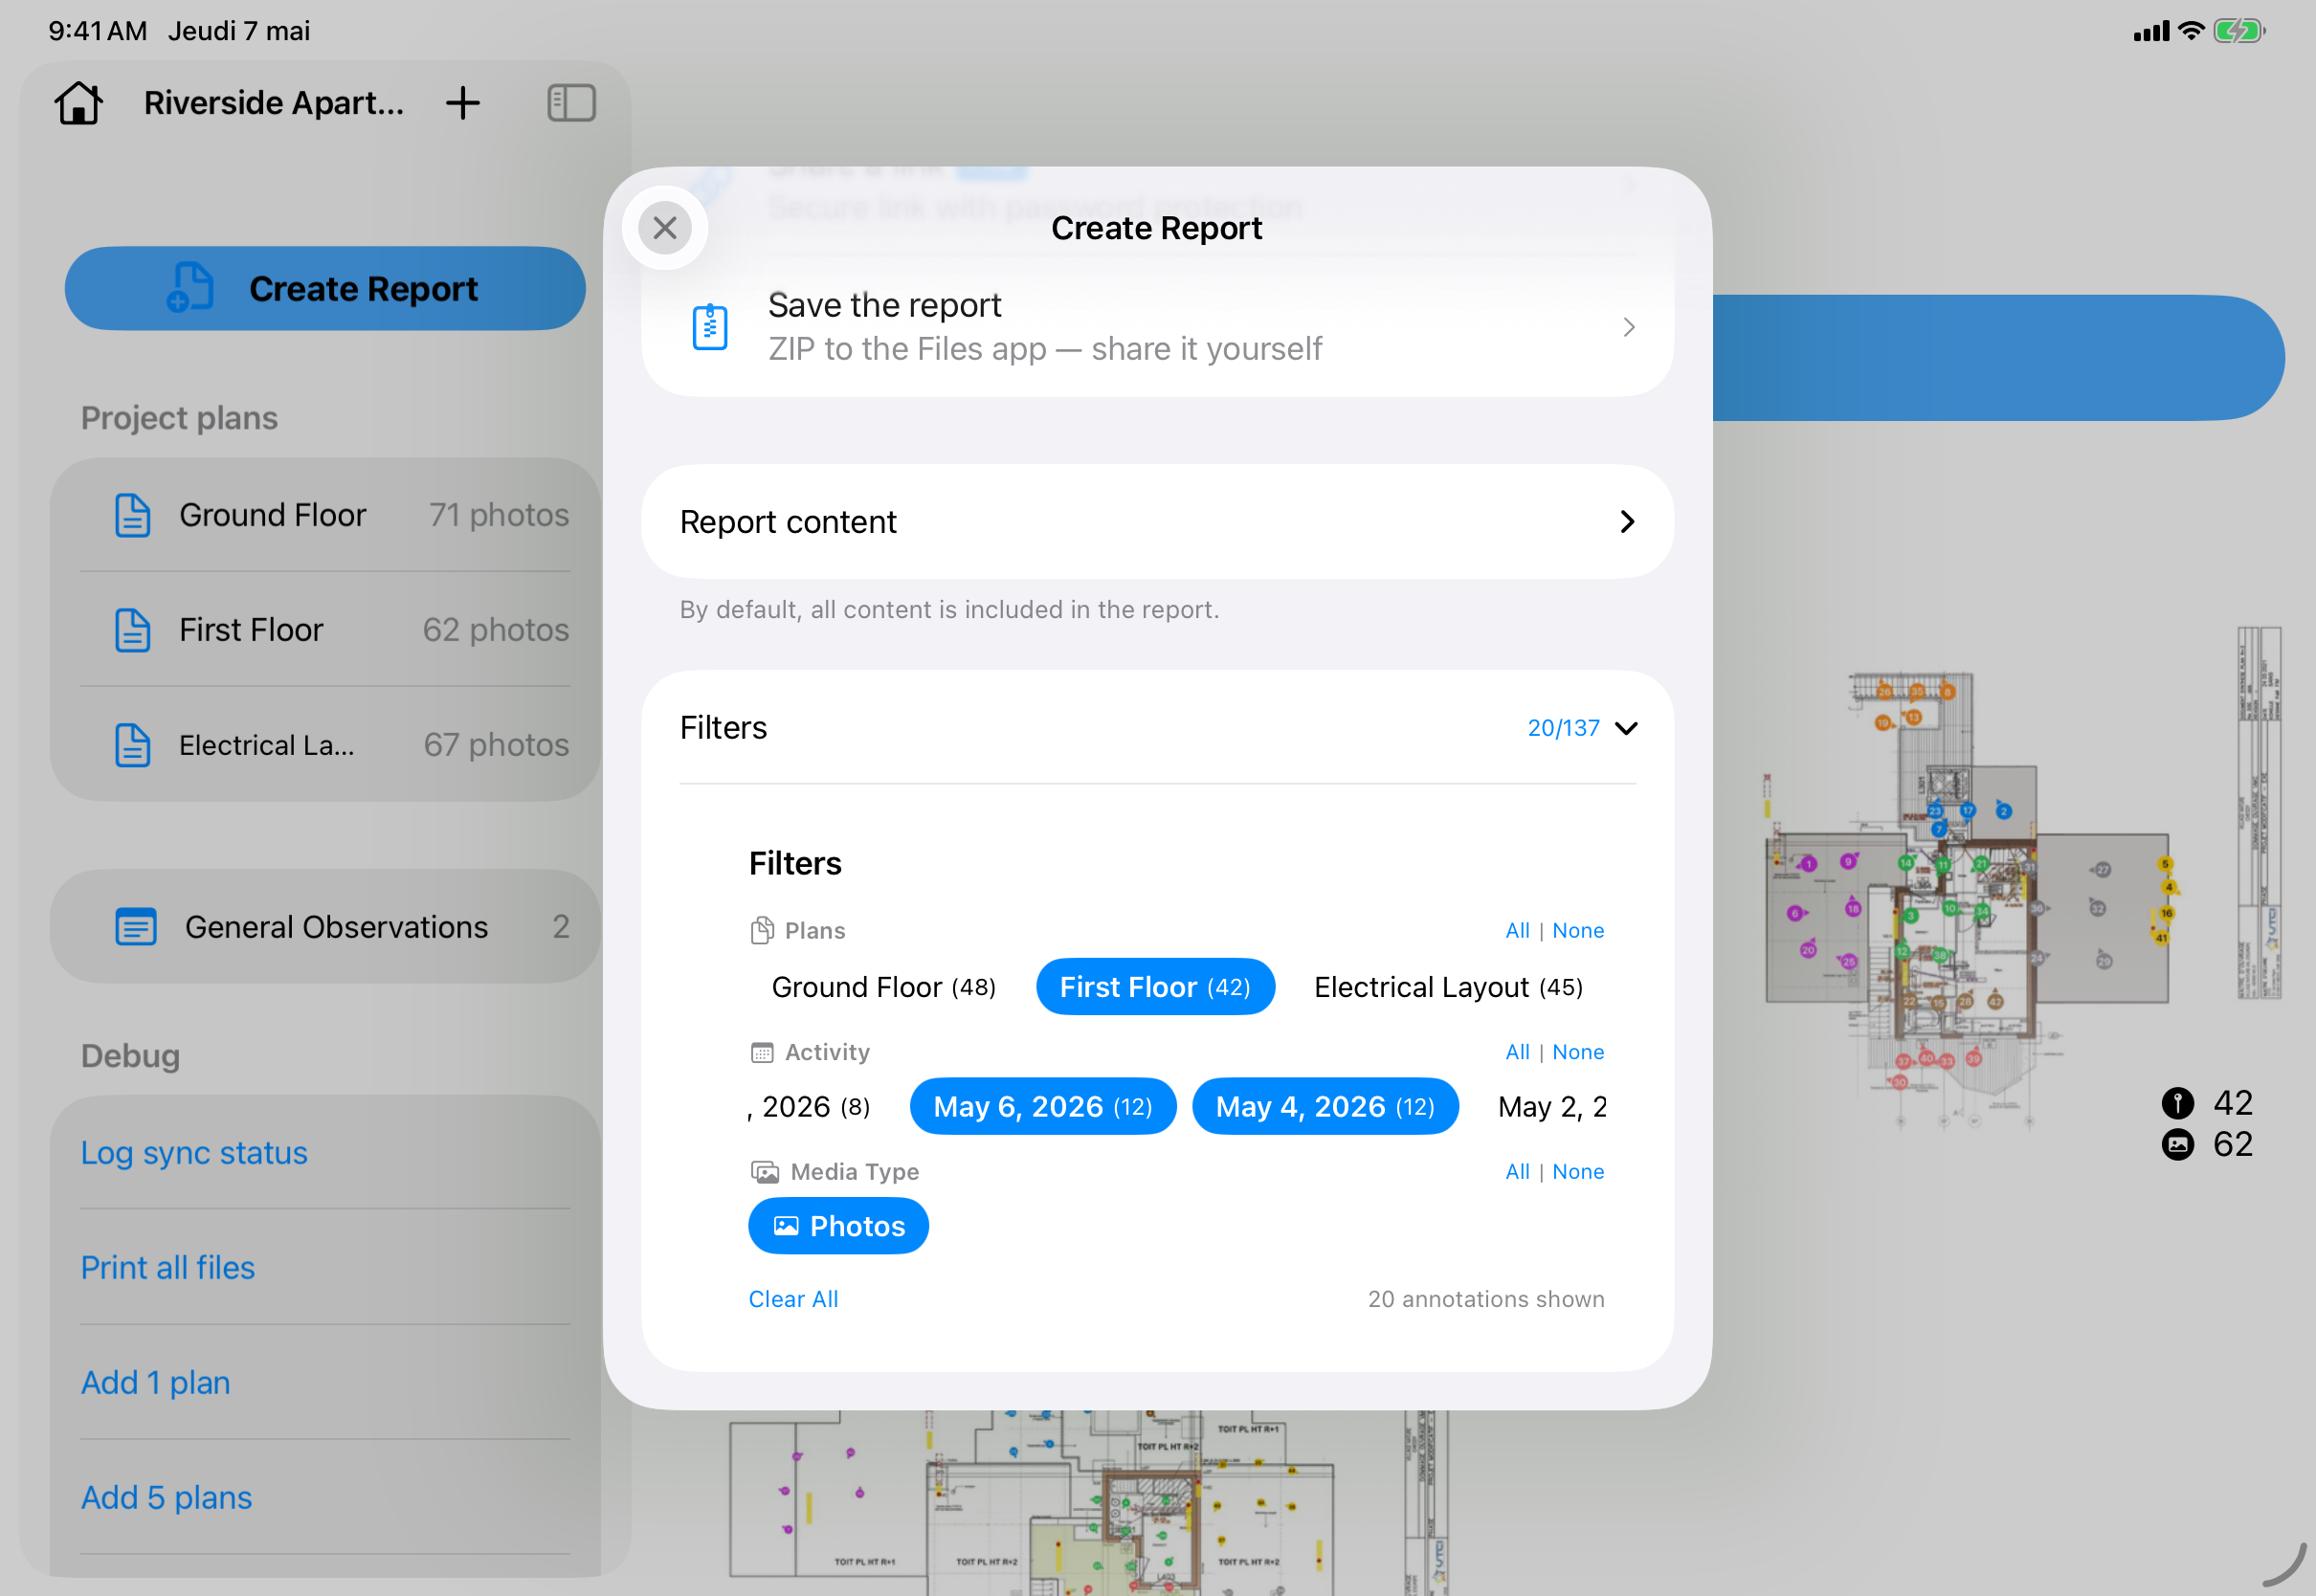
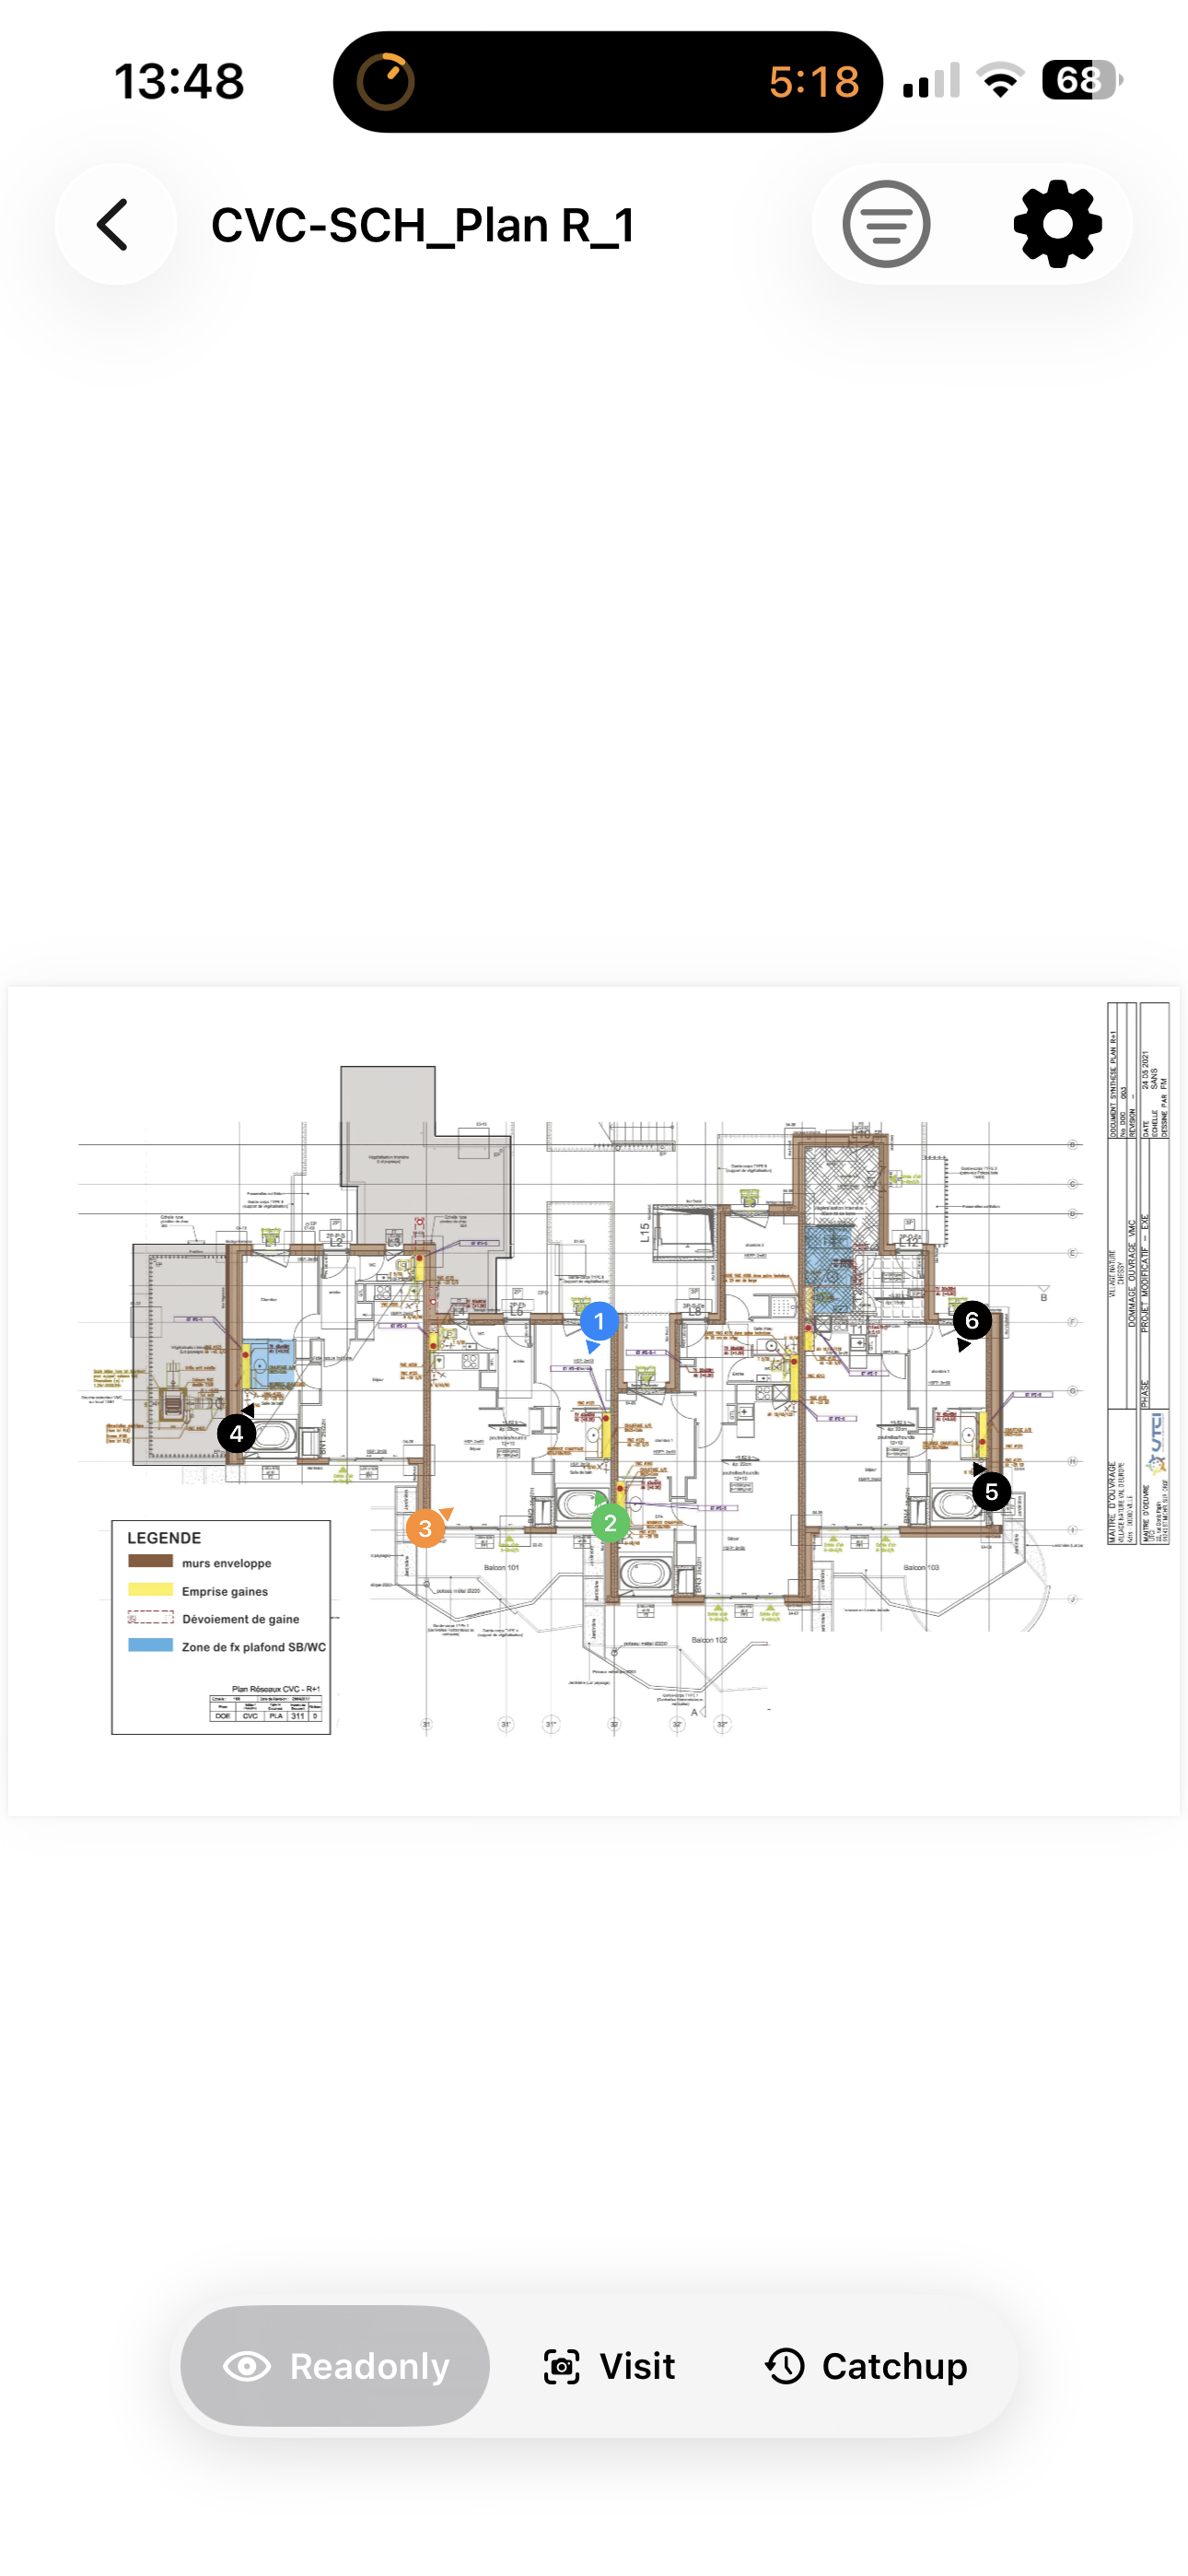
Rather than filling in this table by hand every week, you can see what a complete, automatically generated report looks like, photos located on the plan included.
See the real report, full size
The same report, as a standalone HTML version and as a frozen PDF, just as they are delivered to a client.
Progress photos: the proof that defends the percentage
A percent-complete written in a table can be disputed. A dated photo of the same trade, taken from the same spot week after week, cannot. That is the whole point of progress photos: turning an estimate into a fact on record.
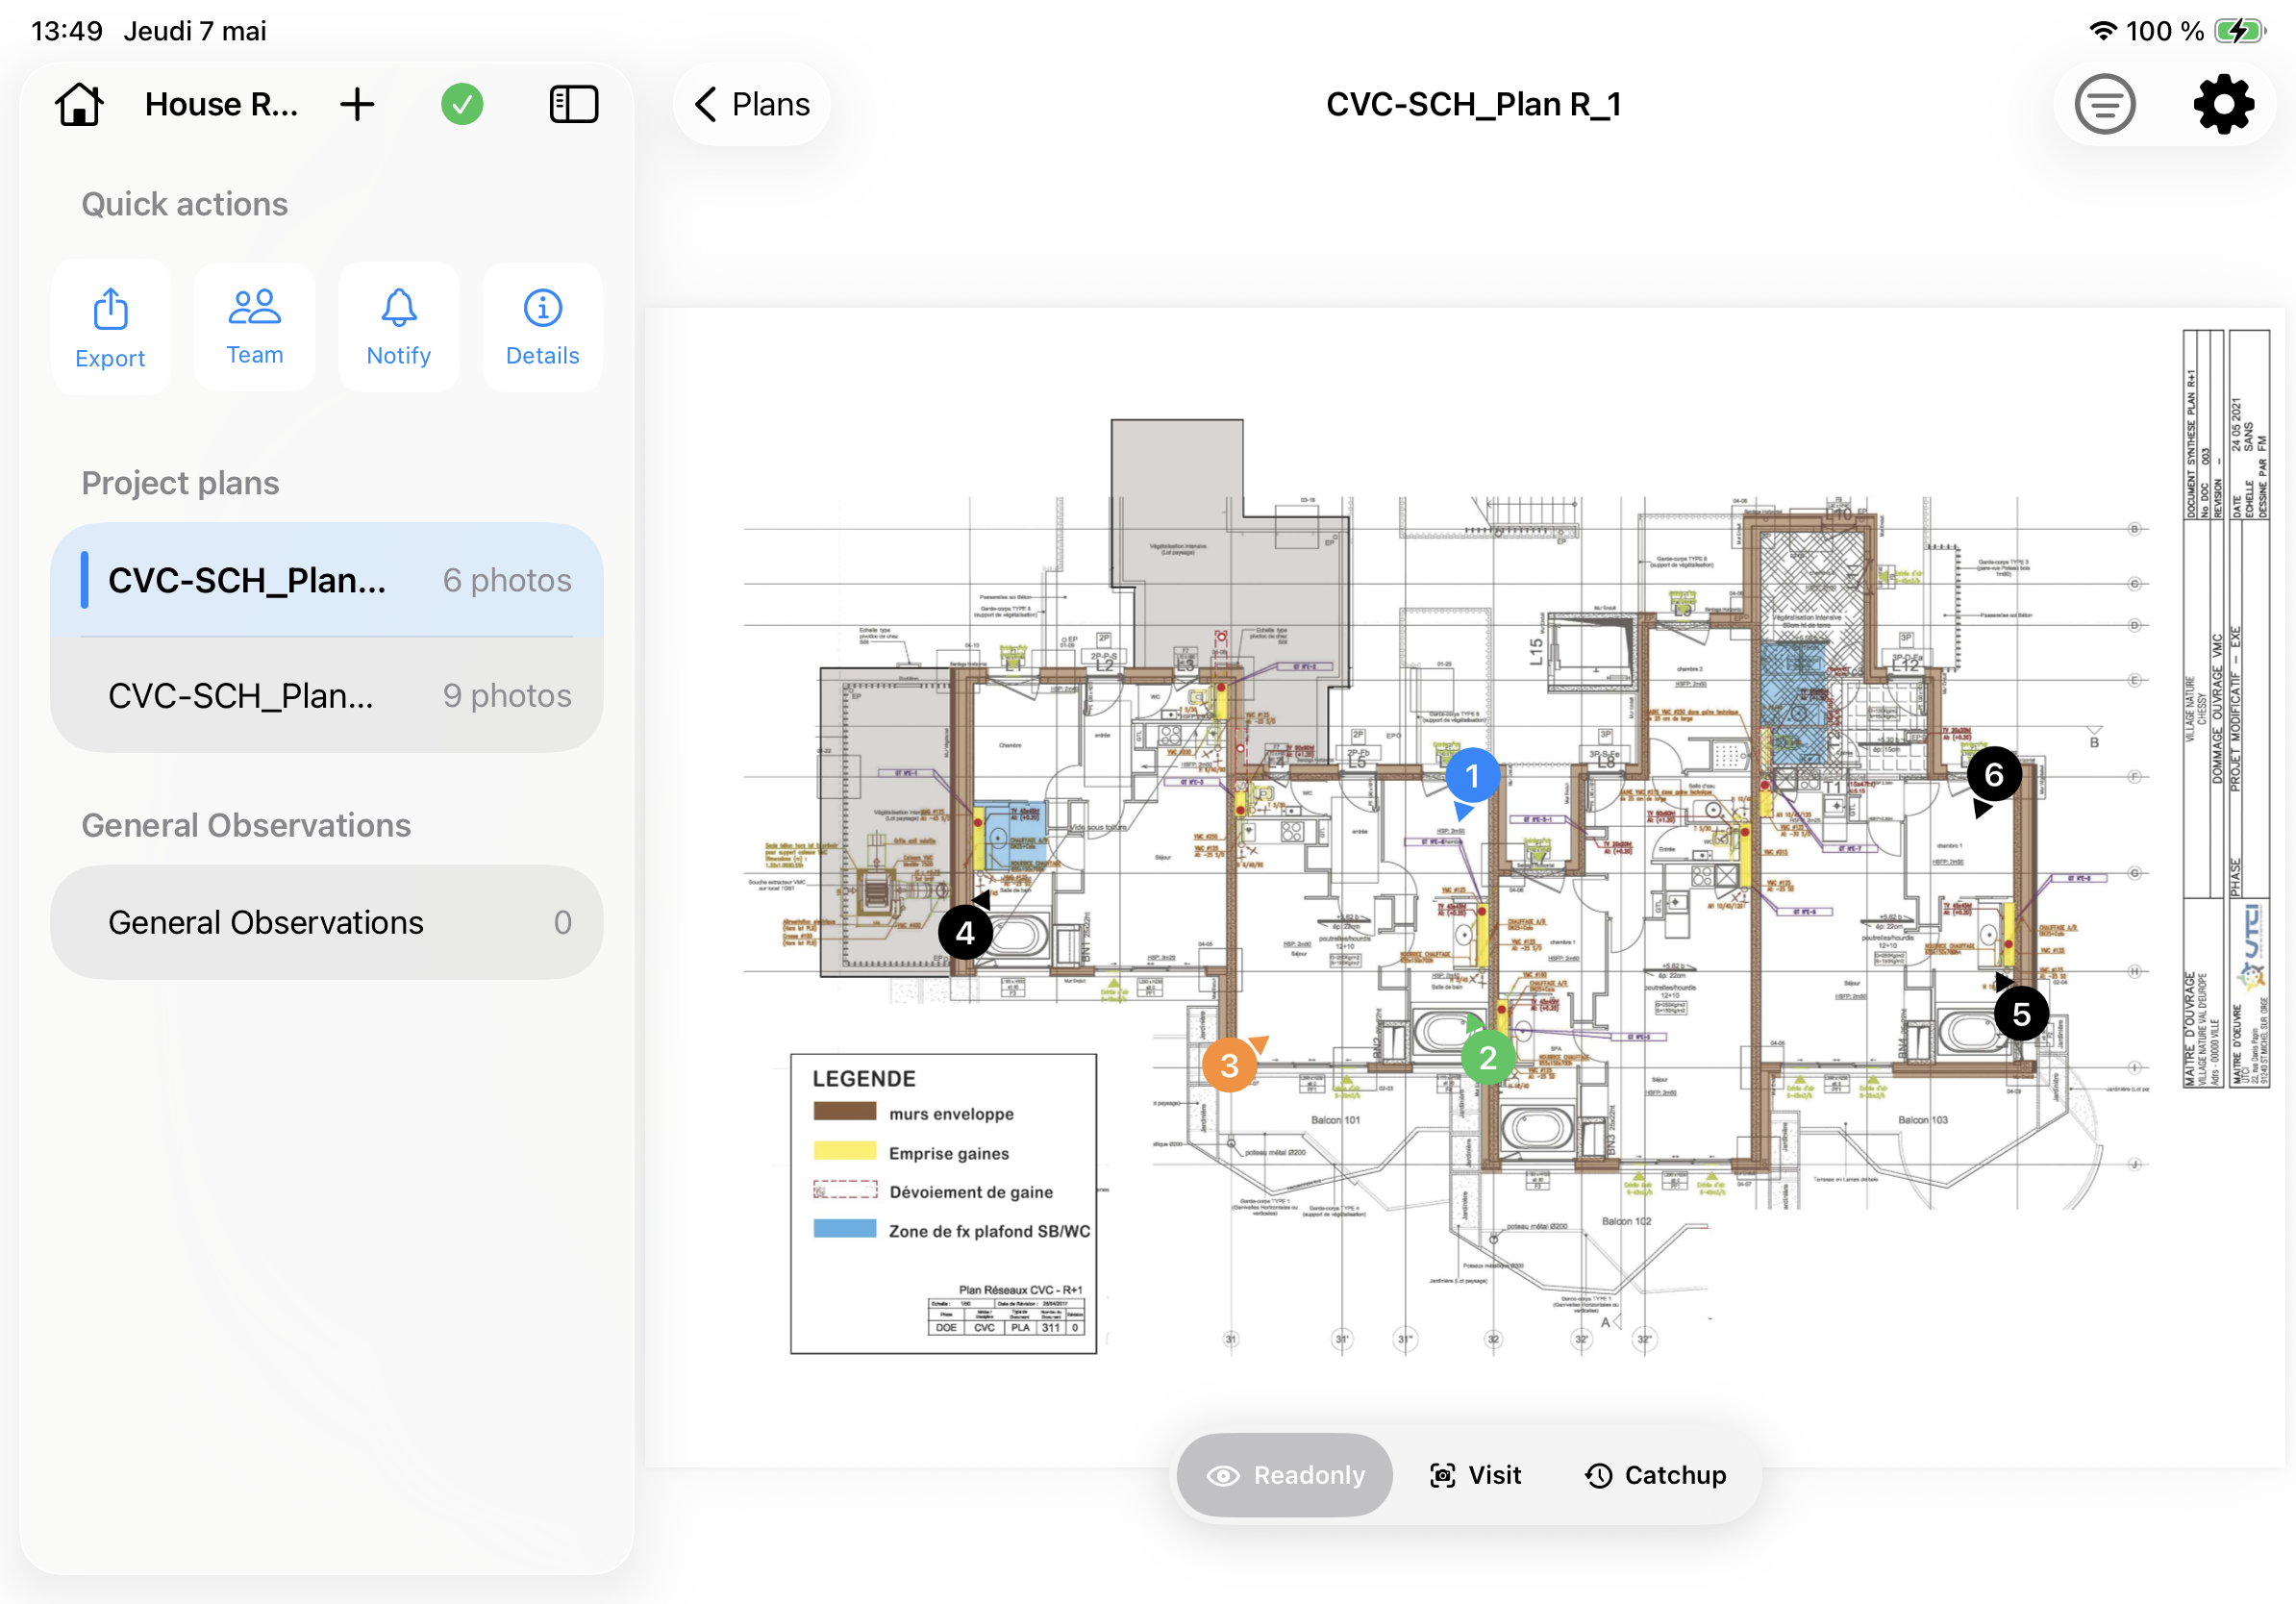
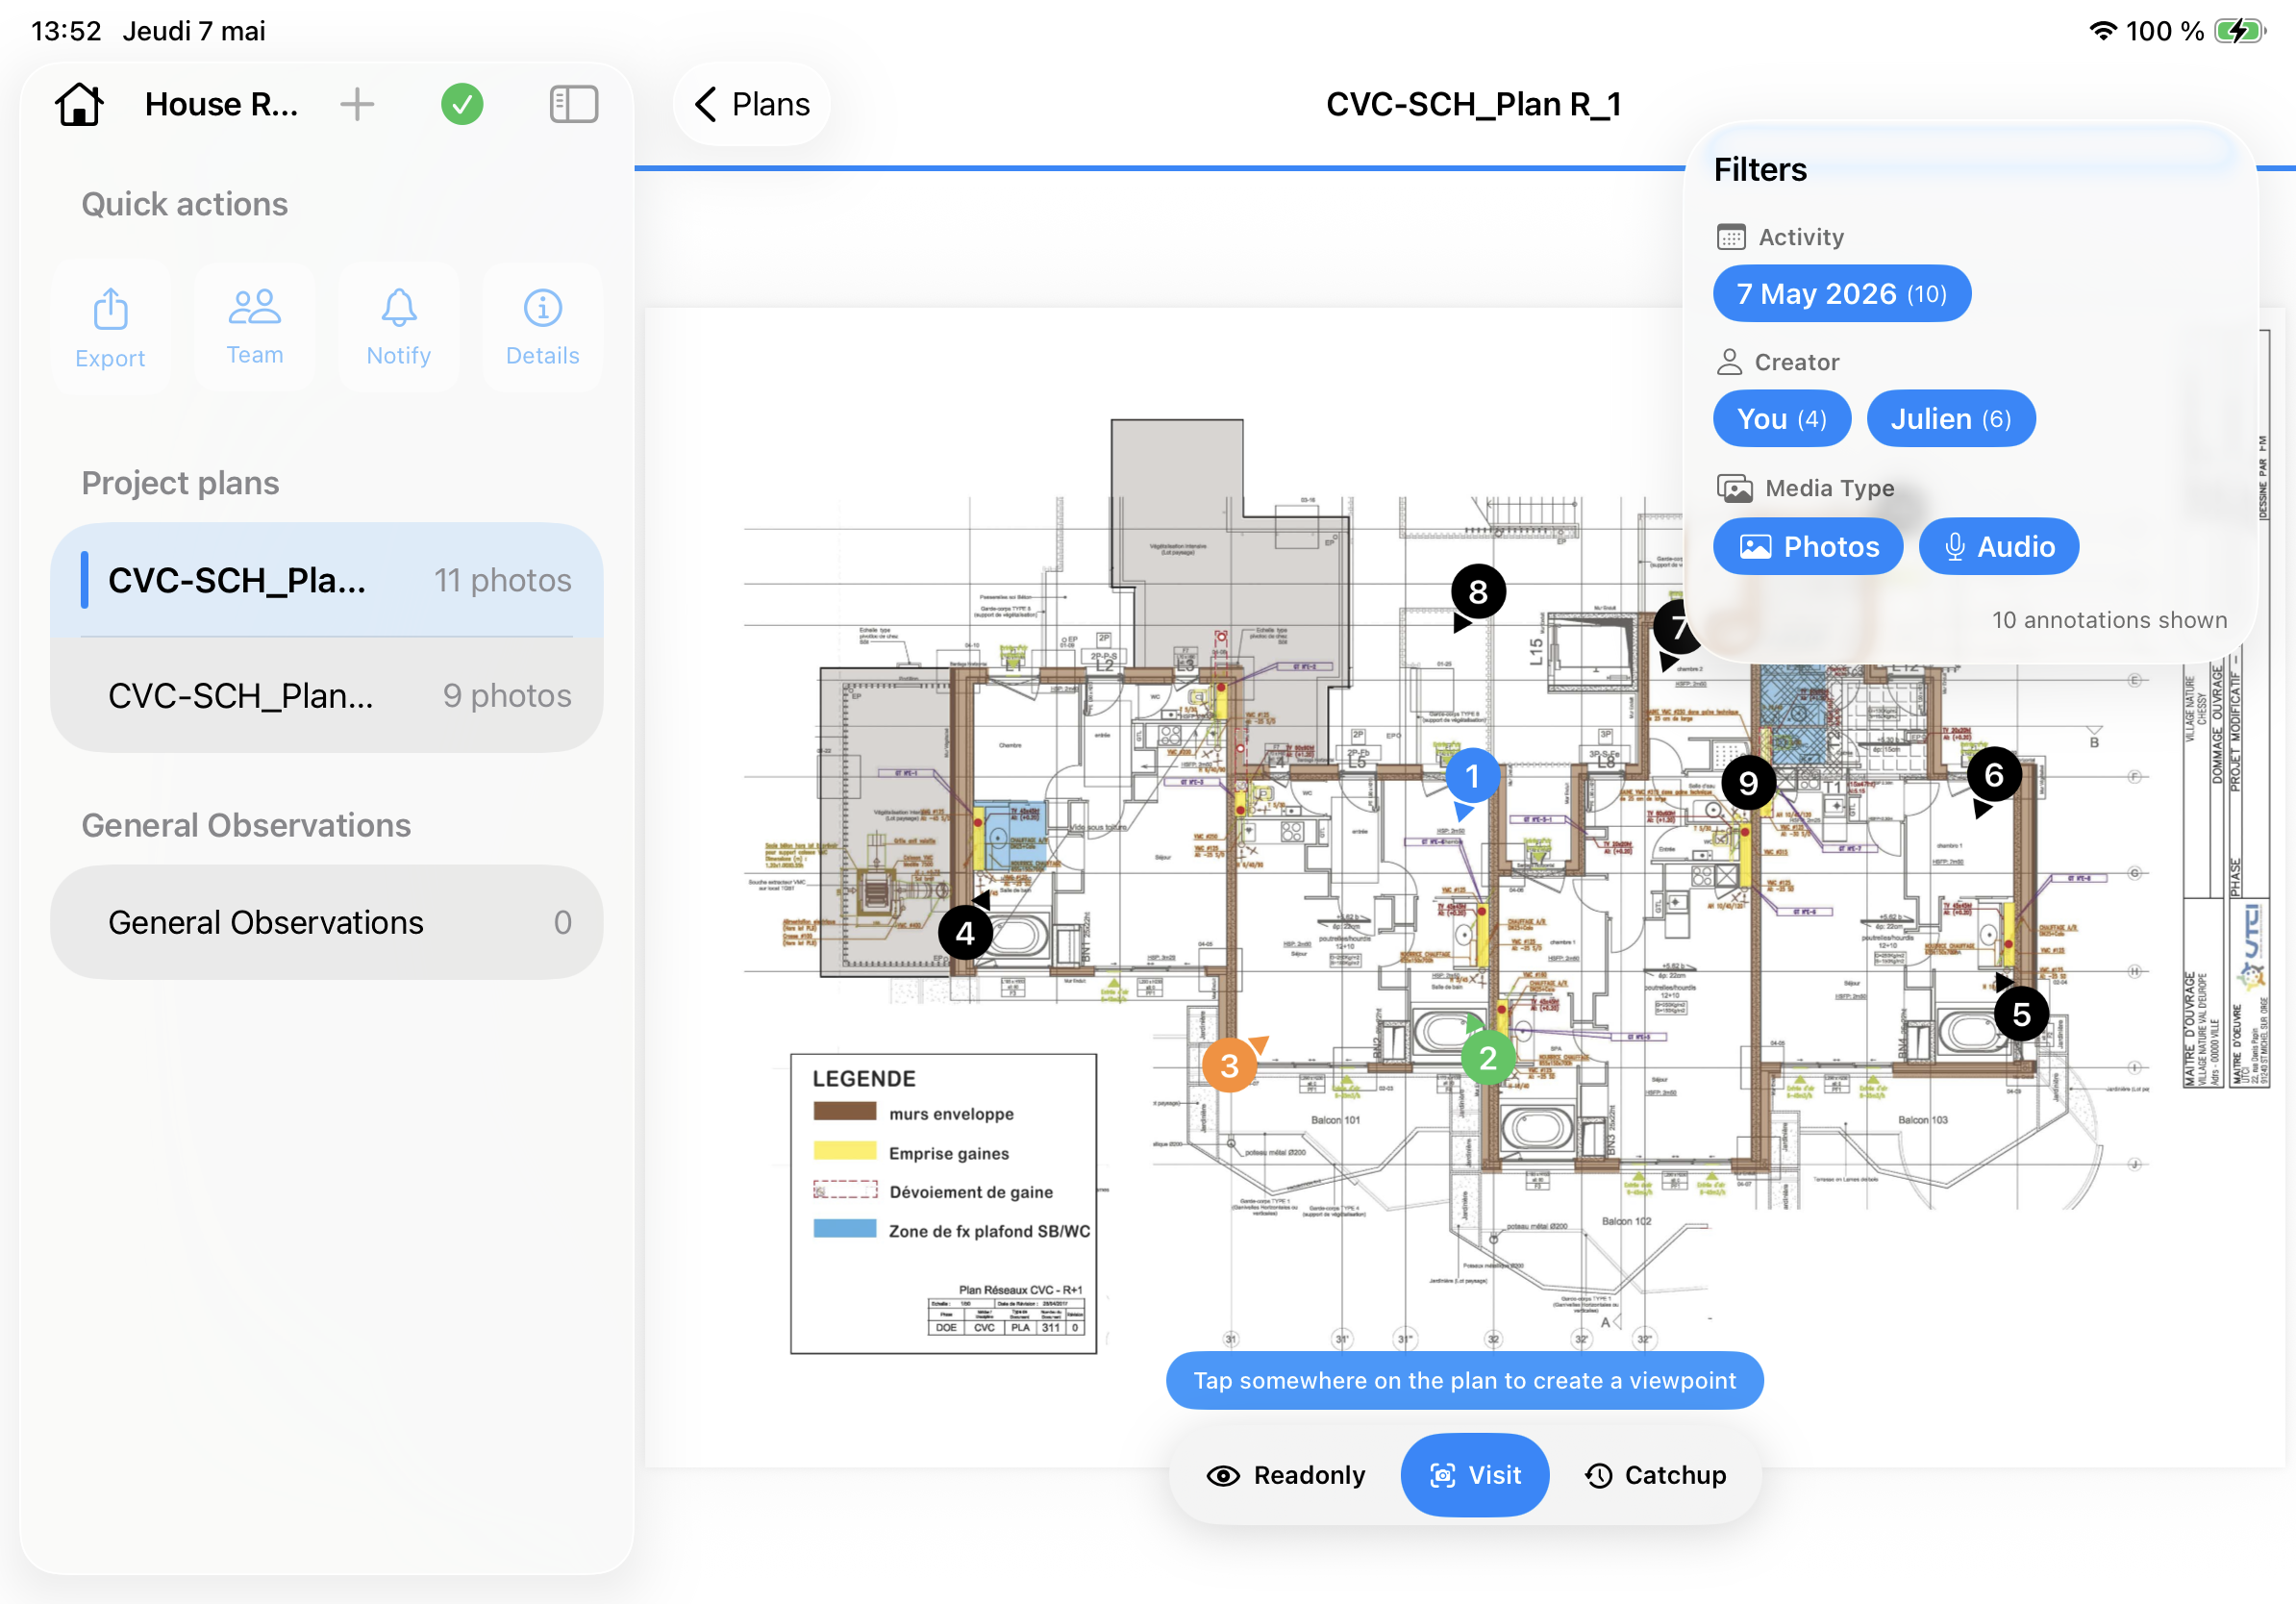
Three rules make these photos genuinely useful. First, always shoot from the same viewpoint from one period to the next, so the progress jumps out when you line the shots up. Second, locate each photo on the plan, so the reader immediately knows which area and which trade you mean. Third, date each photo, because a progress report without reliable dates loses all its evidential value the day of a dispute over deadlines.
That is exactly what PhotoReport does: you tap the position on the PDF plan (one page, the format that works everywhere), you take the photo right after, and it stays pinned to that spot, time-stamped. At the next visit, you find the marker again and reuse the same framing. You can attach an audio comment to each photo, film an HD video for a complex area, then generate the standalone PDF or HTML report on the spot, filtered to the period and the trades that concern each recipient. The free plan allows one unlimited project, with a quota of 3 exports, enough to test a full progress cycle before moving to Pro (19€/month or 190€/year).
5 mistakes that undermine a progress report
Progress reports that end up ignored almost always share the same flaws.
- An overall rate with no breakdown by trade. “67%” doesn’t say where it’s stuck. Without a trade-by-trade split, the figure is unusable and no one can decide anything.
- No photos, or undated photos. A percentage with no visual proof gets disputed at the first rejected claim. A photo without a date is worthless the day of a dispute over deadlines.
- No comparison to the schedule. Stating progress without setting it against the plan hides exactly what matters: the variance. A trade at 55% can be ahead or behind, it all depends on the schedule.
- Blockers with no owner or due date. Flagging a blocker without saying who must act and by when guarantees it will still be there at the next report.
- A report that arrives too late. Progress observed on Tuesday and circulated the following week is no longer any use for deciding. Freshness is part of the usefulness.
Word, Excel or an app
The spreadsheet remains the most common tool for the progress report, and it handles the weighted-rate calculation correctly. Its weak point is not the figure, it is the proof. Inserting, resizing and captioning progress photos in Word or Excel, period after period, while keeping them consistent with the plan, takes one to two hours per report. That is precisely the step that gets dropped when the deadline bites, and the report then loses what made it defensible.
A dedicated mobile app flips the balance of power: capture is already structured on the plan during the visit, and generating the document takes only a few taps. You keep the spreadsheet’s rigor for the rates and you reclaim the time lost on formatting photos. For a full comparison on this point, see PhotoReport versus Word and Excel.
FAQ
What’s the difference between a progress report and a daily construction report?
The daily report is kept every day by the site manager and logs the weather, headcount, tasks done, deliveries and incidents. The progress report is periodic (weekly or monthly) and measures the percentage of works complete by trade, compared to the schedule. The daily report describes, the progress report quantifies and aggregates.
How often should you produce a progress report?
It depends on the phase and the contract. During structural works, where progress is fast, a weekly rhythm is common. During the financial reporting and progress-claim phase, a monthly rhythm often takes over, aligned with payment deadlines. The good benchmark: produce a report whenever a decision (payment, rescheduling) has to rest on actual progress.
How do you calculate a project’s percent-complete?
You first calculate the physical progress of each trade (the share of works actually carried out), then weight by each trade’s share of the contract amount to get the overall rate. Structural works at 100% that account for 30% of the contract contribute 30 points to the overall rate. Financial progress follows the same logic applied to prices, and can differ from physical depending on which items are installed.
Does the progress report have contractual value?
It frequently serves as the basis for progress claims and the payment of interim amounts, which gives it real contractual weight. In a dispute over deadlines, the series of dated reports forms an enforceable history showing when each trade fell behind and who had been informed. For that reason, rates documented with dated photos are worth far more than unsupported estimates.
Which tool lets you make a progress report quickly?
The spreadsheet stays handy for the weighted-rate calculation. The bottleneck is fitting in the progress photos, which takes one to two hours per report in Word or Excel. An app like PhotoReport removes that step: photos pinned to the plan during the visit, automatic generation of the PDF or HTML filtered by period and by trade. The calculation stays rigorous, the formatting disappears.
Try PhotoReport on your next progress review
PhotoReport is a native iOS app that fits the essentials in your pocket: photos pinned to a one-page PDF plan, dated and re-shootable from one visit to the next, audio comments, HD videos, report generation on the spot, and sharing per recipient filtered by period and trade. The free plan allows one unlimited project with three exports, enough to measure the gain over a full progress cycle before any commitment.